New Studies
A. Statistic
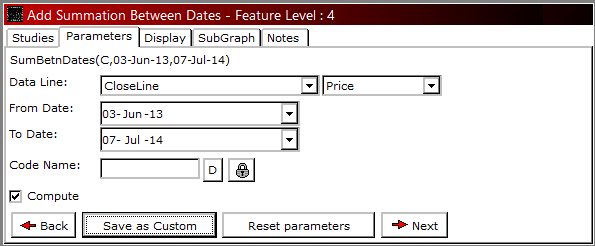
Summation Between Dates - It will sum up all successive DataLine Inputs for all trading days falling between the dates ranges specified by the user.

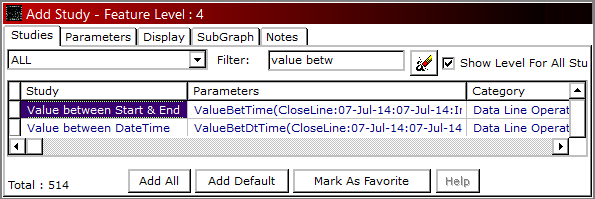
Value Between Start & End Time - It can be used on intraday charts to plot DataLine Input's value specified by the user.
Start Time will pick up the candle and DataLine Input of that time and plot that value till the market end time if considered end time is checked,
else will carry till the next day till the same time is encountered. Further user can write the condition on it to say if
the price breaks that value anytime during the day, he can go long or short. The same can be back tested using a strategy across intraday data.
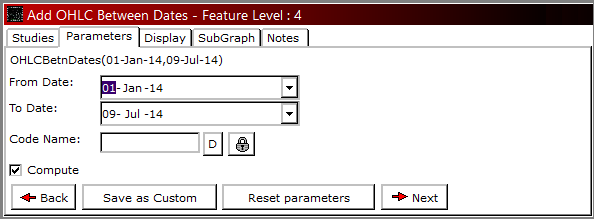
OHLC Between Dates - As we plot OHLC value of a daily candle, this study plots the OHLC value for Date Range Specified.
For. E.g. Specifying from Date as 1st Jan 2014 and To Date as 31st May 2014 in this indicator will Plot Open of 1st Jan 2014,
High as Highest High between dates range specified, Low as Lowest Low between date range specified and Close of 31st May 2014 till the last bar.
It is carried till the last bar to detect breakout of High or Low for that date range.

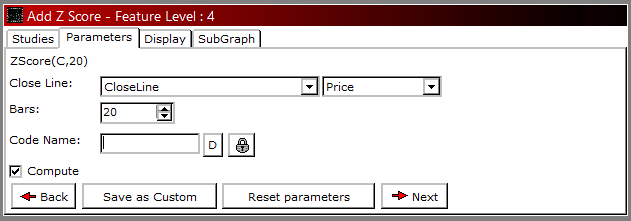
Z Score - This indicator plots a range starting from -2 level to +2 Level. It defines by
how much factor the price has deviated from its specified average (Bars Input). Indicator's
reading above 2 means prices has deviated 2 times more than the average on the upper side,
and the same falling below +2 gives an opportunity to sell. Similarly its reading below -2 means
price has deviated 2 times less than the average on the lower side and the same rising above -2 gives a buying opportunity.

B. Data Line Operations
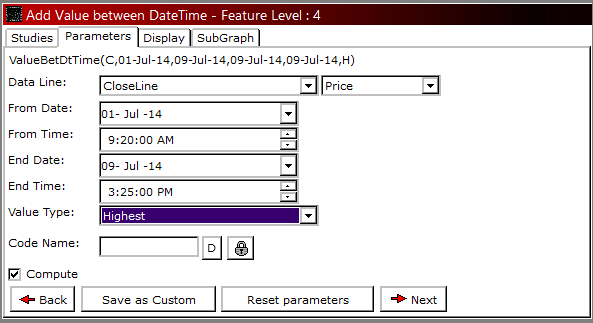
Value Between DateTime - This study returns Highest / Lowest value, Highest / Lowest Trigger Date and number of days (Calendar Days) passed from Highest
/ Lowest Trigger date of the DataLine Input specified by the user. It is a single study which can be used to get all 3 outputs in 1 step instead
using 3 other indicators (High Low Value Between DateTime, High Low Days Between DateTime, High Low Date Between DateTime) for the same output.


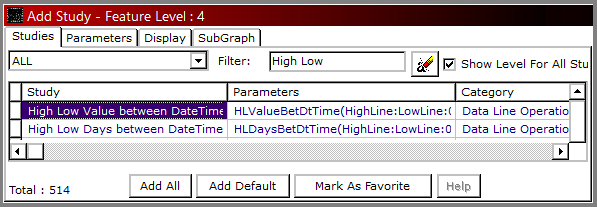
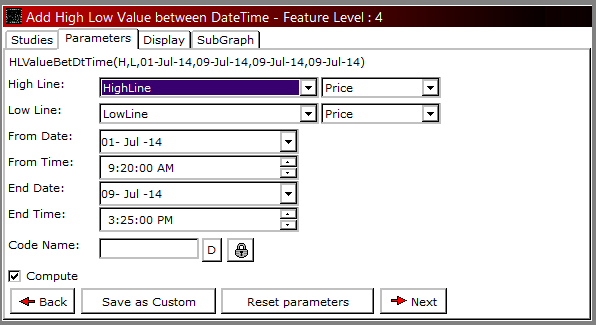
High Low Value Between DateTime - This study returns the Highest High and Lowest Low value triggered between the DateTime defined.
This study is normally used in reporting system. When a user wants to know the highest high and lowest low value between two dates, he can use this study.
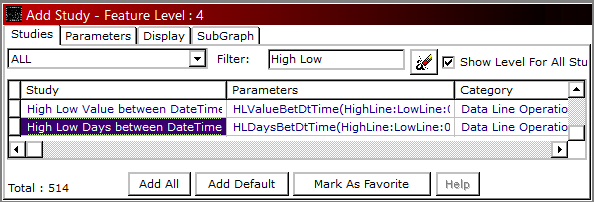
High Low Days Between DateTime - This study returns the number of days (Calendar Days)
passed from the Highest High day and Lowest Low day. This study is used in reporting system.
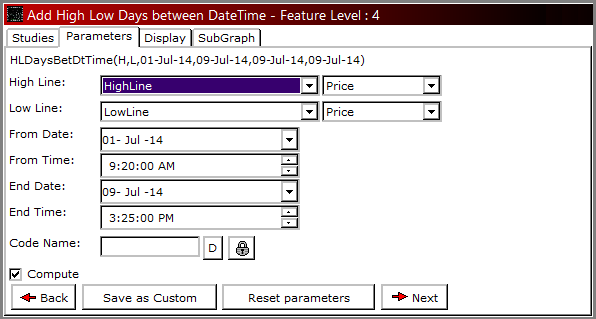
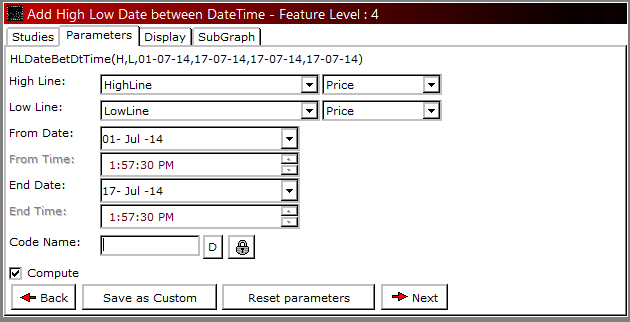
High Low Date Between DateTime - This study returns the date of Highest High Day and Lowest Low Day. This study is used in reporting system

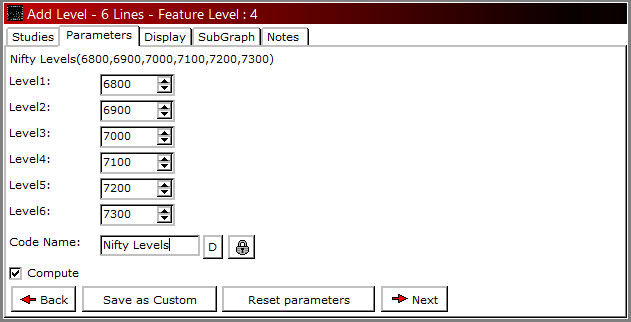
Level - 6 Lines - Plots 6 user defined levels on Price Chart.
It functions the same way as Level - 2 Lines or Level - 1 Line does. Here in 1 step, user can plot 6 levels or less on chart. Further, it can be used to write condition or plot signals on a specific / multiple level breakouts showing buying or selling opportunities.

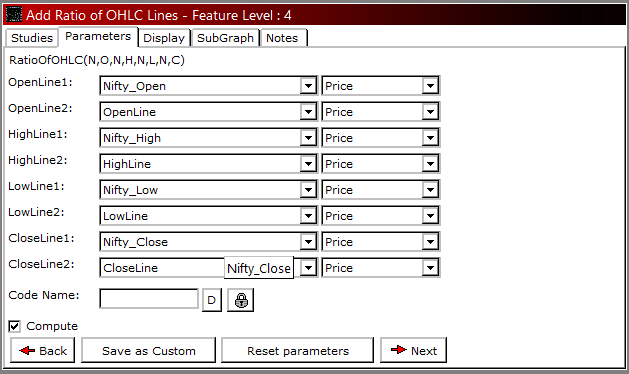
Ratio Of OHLC Lines - Spread traders uses this study. Study named Ratio Of Lines enables user to find out the Spread ratio between 2
contracts by plotting Another Scrip Close on the existing chart and using their prices as input in the study. This upgraded study
can help these users to plot not only close price difference but OHLC price difference too. The same can be plotted in Candlestick form,
where further averages and other indicators can be plotted over.

Max Of Lines (10) - Plots or return a Highest value among 10 or less input values specified by the user.
Let say there are 4 to 5 moving averages or Price based indicators on the chart and the user wants to know the highest value of all so that he can place that as a stop loss for a Buy Trade.
Min Of Lines (10) - Plots or return a Lowest value among 10 or lesser input values specified by the user. Let say there are 4 to 5 moving averages or
Price based indicators on the chart and the user wants to know the lowest value of all so that he can place that as a stop loss for a Sell Trade. This is when he can use this study.

Line Addition - This study in the new version has been renamed to Add To Line.
Line Subtraction - This study in the new version has been renamed to Subtract From Line.
C. Volume
Buy Sell Qty - It can be plotted on Intraday Charts. This plots two lines on a sub-graph, 1 line gives value of the sum of all buy ticks,
and the other line gives the value of sum of all sell ticks on each bar. 1st Line (BuyQty) higher than 2nd Line (SellQty) would mean Buyers are taking control and vice versa.

Buy Sell Tick Count - This study gives count of all buy and sell trades on each bar.
BuyTickCount higher than SellTickCount would mean that Buyers are taking control and vice versa.

Buy Qty % / Sell Qty % - It’s a percentage distribution between Buy and Sell ticks on each bar. BuyQty % gives percentage of BuyTrades, similarly SellQty % gives percentage of SellTrades.
BuyQty% higher than SellQty% would mean that Buyers are in control and vice versa.

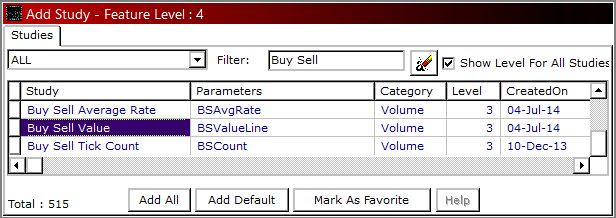
Buy Sell Value - This study plots 2 lines. 1st line gives output of Buy Value (BuyQty*ClosePrice) calculated on each tick.
Similarly, 2nd line gives output of Sell Value (SellQty*ClosePrice) calculated on each tick.
It is interpreted as when BuyValue line is above SellValue line it is trending upward and vice-versa.
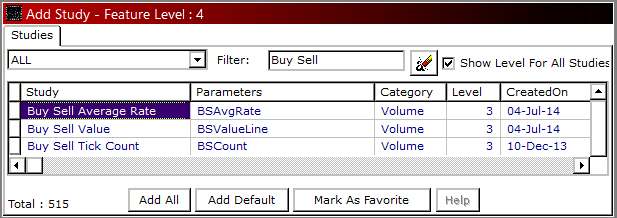
Buy Sell Average Rate - This study plots 2 lines. 1st line gives output of Buy Average Rate (BuyValue / BuyQty) calculated on each tick.
Similarly, 2nd line gives output of Sell Value (SellValue / SellQty) calculated on each tick. It is interpreted as when BuyAvgRate line is above
SellAvgRate line it is trending upward and vice-versa.
D. Price
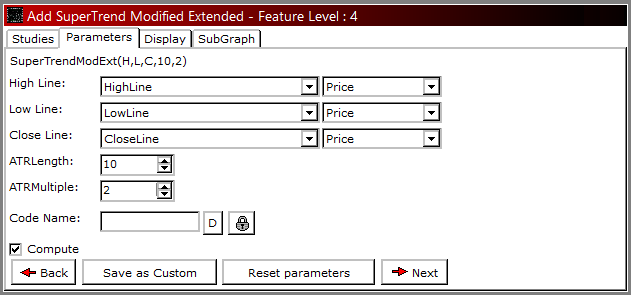
SuperTrend Modified Extended - In old study Super Trend Modified, user could only change the input parameters of ATR Length and ATR Multiple factors, based on which Super Trend Modified use to plot it considering by default High, Low and Close prices.
Now with this study in place, use can change the price inputs of High, Low and Close too.
If Prices are above Super Trend Value, it is said to be in Buy zone with Stop Loss of Super Trend Value and vice versa.

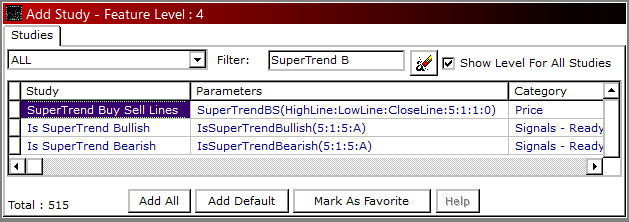
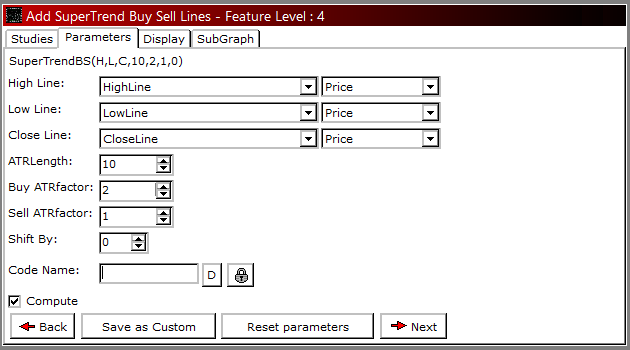
SuperTrend Buy Sell - This study is similar to SuperTrend Modified except it plots Buy SuperTrend and Sell SuperTrend Lines differently
if Buy Factor and Sell Factor are not same. To plot Buy SuperTrend line, it takes ATR Length and Buy ATRFactor inputs and for Sell SuperTrend
Line; it takes same ATR Length and Sell ATRFactor inputs.
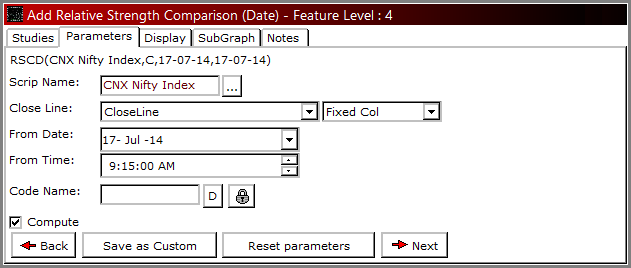
Relative Strength Comparison (Date) - This study compares two securities to analyze their performances.
It finds the percentage ratio of input price line (OHLC) for two different securities from a specific date.
When the value returned by this indicator moves up, the security is out-performing the input security,
similarly when it is moving down, it is said to be underperforming than the input security.

Volume Weighted Average Price - is a new name given to Up To Tick Avg.
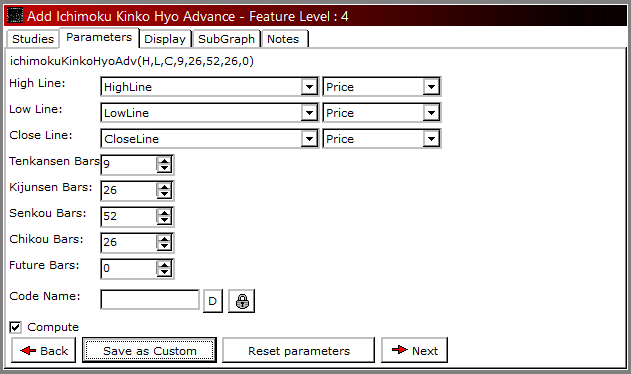
Ichimoku Kinko Hyo Advance - Advance name in this indicator is because here user can opt to have future bars display of
this indicator's value or not. If future bars is specified as 0,
this indicator will not extend, else it will extend for a number of bars ahead as specified.

E. Options
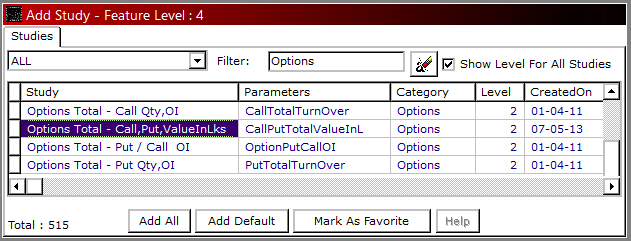
Options Total - Call, Put, ValueInLakhs - This indicator plots 2 lines on sub-graph. One gives
Call Total Turnover and the other gives Put Total Turnover in Lakhs for the corresponding contract.
At the Money - This indicator plots At the Money Option’s Strike Price on the chart


F. Momentum
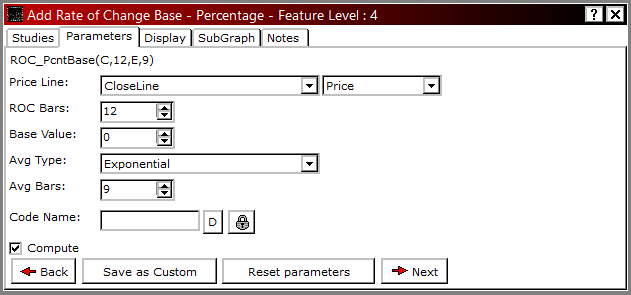
Rate Of Change Base - Percentage - It measures the percentage change in price with price n periods (ROC Bars) ago,
however with a base value specified. The other indicator named Rate Of Change has a default base value of 100.
It behaves the same way as ROC except the reading of normal ROC gets added to 100 value if base is 0. Similarly,
if base value is 10, ROC value gets added to 90 on each bar and likewise. Along with ROC Line,
A signal line which is a moving average of ROC Line by 9 bars is plotted.
If ROC is above level (100-BaseValue), it is said to be trading in Positive territory and vice versa.

G. Overbought / Oversold
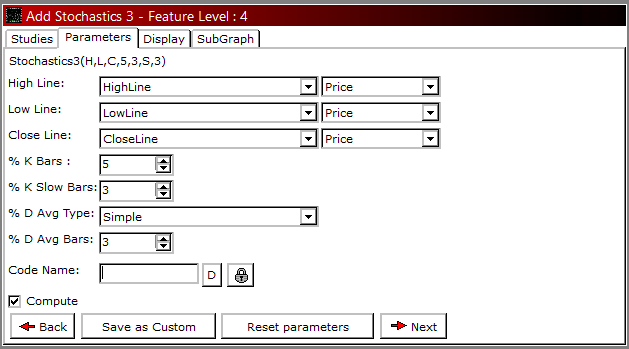
Stochastics3 - It is a momentum indicator that shows the location of the current close relative to High-Low Range over last N-time periods.
This calculation gives stochastic %K value. Further to smoothen this, moving average of %K is calculated to give stochastic %K Slow value.
To further smooth it out, moving average of %K Slow is calculated to give stochastic %D value which has 3 outputs.
Readings over 70 indicate overbought zone and reading below 30 indicate oversold zone in a sideways market.

Strategy – Advance Ultimate
Add Study --> Strategy – Advance Ultimate
With the introduction of Strategy - Advance Ultimate, user can now execute their long and short trades with
different Priceline entry and exit point respectively while testing strategies. This study is available to pro users.